
Selected Grade 8 mathematics
Explain and Compare Linear Relationships
Prepare the materials
Prepare this lesson or activity
Recommended selection edition 1.0.0. Original source files retain their displayed editions.
Use the matching guide to choose a response to the work you observe. Clarify access and task wording first; one response is not a diagnosis. Keep independent work, later tasks and answers aside until their intended use.
- Audience / fit
- Selected Grade 8 math
- Teaching or planning target
- Find change per input unit from unequal intervals, recover an initial value from nonzero observations, and compare linear models. Supplied teaching, targeted responses, different later checks and transfer include complete keys.
- Essential prerequisites
- Students can interpret paired quantities and per-one meaning, coordinates and nonzero starting amounts. Use the linked Grade 6 ratio/per-one and selected Grade 7 lessons when these need teaching.
- Preparation
- Read the Start Here selections; preparation time depends on the selected route.
- Use time
- Use the teacher guide to plan the selected route
- Materials
- Selected student pages, paper and pencil or an established response method, and the separate teacher guide.
- What to print
- Print the chosen activity. Follow the source or reveal instructions beside it.
Evidence to notice: Look separately at change per input unit and starting value, then compare outputs at the same input using the supplied representations.
Preview the actual student page
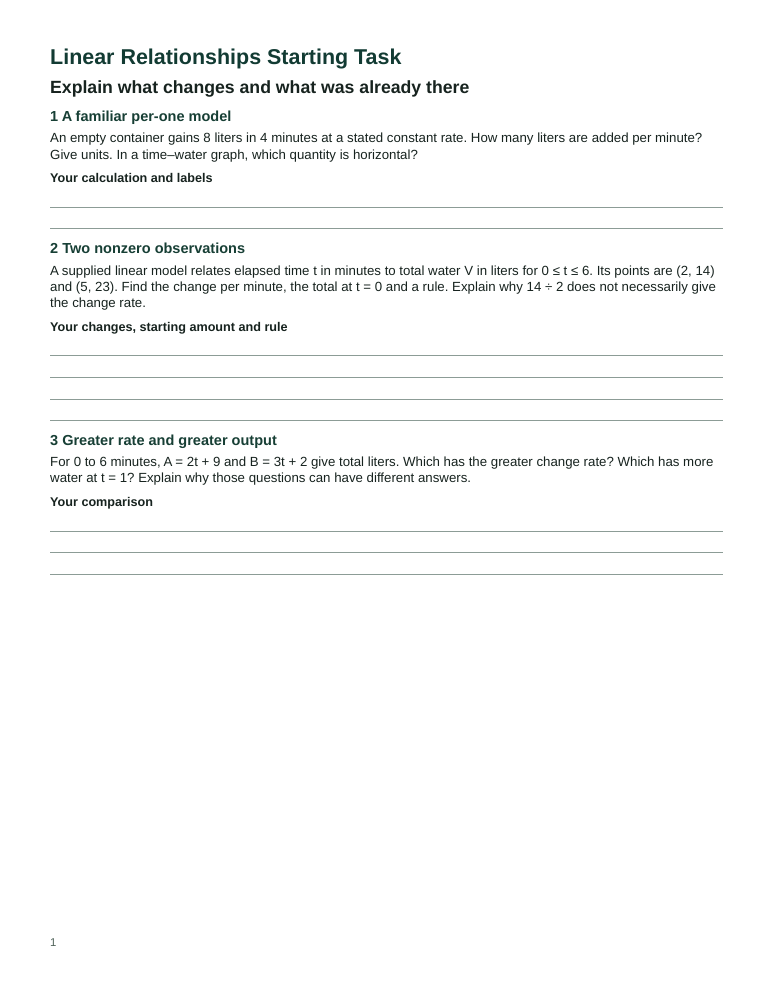
Start with the selected task
Matching teacher guide and answers — keep separate: Matching teacher guide and answers · 10 pages.
Compare the observed response with the guide’s criteria. Clarify access and wording, then use its conditional directions to choose an activity below. Follow-up and later tasks are not interchangeable test forms.
Choose another activity or format
- Starting task · 1 page
PDF · Editable Word · Browser copy - Rate from changes · 3 pages
PDF · Editable Word · Browser copy - Build a rule and graph · 4 pages
PDF · Editable Word · Browser copy - Compare rate and output · 3 pages
PDF · Editable Word · Browser copy - Independent check · 2 pages
PDF · Editable Word · Browser copy - Match the input changes · 1 page
PDF · Editable Word · Browser copy - Recover the starting value · 1 page
PDF · Editable Word · Browser copy - Compare at the same input · 1 page
PDF · Editable Word · Browser copy - Follow up check · 3 pages
PDF · Editable Word · Browser copy - Later transfer · 2 pages
PDF · Editable Word · Browser copy
Teacher files — separately
- Start here · 2 pages · Teacher PDF · Editable teacher Word · Teacher browser copy
- Decision record · 1 page · Teacher PDF · Editable teacher Word · Teacher browser copy
- Matching teacher guide and answers · 10 pages · Teacher PDF · Editable teacher Word · Teacher browser copy
More fit notes, formats and teaching guidance below · Write a local teaching plan
Choose from the response
Choose the next teaching move
Describe what the learner said, wrote or showed. Check access, wording, prerequisites and calculation before interpreting it. A single response is not a diagnosis. Record support and prior exposure; a helped or rehearsed task is practice.
Teach the meanings before the independent check. Address calculation separately from the model. The follow-up introduces a different signed-rate demand; later transfer changes quantity and domain demands. Record support/exposure, and keep unused tasks and all keys with the teacher.
Start with the supplied materials
- Rate from changes · PDF · 3 pages
- Build a rule and graph · PDF · 4 pages
- Compare rate and output · PDF · 3 pages
Observe, clarify and select one response
Output change is divided by one input, or unequal jumps are compared directly.
Teaching move: Match the Input Changes, then try an unused two-point task.
Read the matching teacher directions; keep answers with the teacher.
A nonzero observed output is called the start, or the start is omitted.
Teaching move: Recover the Starting Value, then use a new rule and interpretation.
Read the matching teacher directions; keep answers with the teacher.
Greater rate or starting amount is treated as greater output at every input.
Teaching move: Compare at the Same Input, then use an unused comparison.
Read the matching teacher directions; keep answers with the teacher.
Rate and start are sound but labels or graph evidence are missing.
Teaching move: Return to the relevant representation practice with neutral labels or an agreed response mode.
Read the matching teacher directions; keep answers with the teacher.
Reasoning is secure on the supplied tasks.
Teaching move: Consolidate the explanation, then reserve Later Transfer for another occasion. Use the guide’s two-record model question for a deeper reasoning demand.
Read the matching teacher directions; keep answers with the teacher.
Look again after teaching
After the supplied teaching and guided practice, give the selected independent task without its answers. Use its explanation to choose a response above.
After selected response teaching and another learning opportunity, use the unused follow-up task.
Return on a later occasion
Reserve these tasks until their intended use. They have different demands; do not treat them as equivalent tests or proof of broad mastery.
Return to preparation and all formats · Complete teacher guide and answers
Detailed fit, more formats and teaching guidance
Is this the right resource?
- Audience / fit
- Selected Grade 8 math
- Teaching or planning target
- Find change per input unit from unequal intervals, recover an initial value from nonzero observations, and compare linear models. Supplied teaching, targeted responses, different later checks and transfer include complete keys.
- Essential prerequisites
- Students can interpret paired quantities and per-one meaning, coordinates and nonzero starting amounts. Use the linked Grade 6 ratio/per-one and selected Grade 7 lessons when these need teaching.
- Preparation
- Read the Start Here selections; preparation time depends on the selected route.
- Use time
- Use the teacher guide to plan the selected route
- Materials
- Selected student pages, paper and pencil or an established response method, and the separate teacher guide.
- What to print
- Use the primary PDF choice below and its matching adult guide. Print only the phase/task being used; keep complete keys and later checks with the teacher.
Start teaching
Readiness task: rate and starting value · PDF (1 pages)
Read the starting and print guide · PDF (2 pages)
Complete teacher guide, answers and alternatives · PDF (10 pages)
Print only the student pages you plan to use. Keep teacher answers and later checks with the teacher until their intended use.
Formats and all files
Browse free resources · Collection and entry route
Find change per input unit from unequal intervals, recover an initial value from nonzero observations, and compare linear models. Supplied teaching, targeted responses, different later checks and transfer include complete keys.
Choose the entry point
- Group or measured-share meaning is unclear: use Equal Groups, Comparisons and Shares.
- Paired quantities or per-one direction need teaching: use Equivalent Ratios, then Find and Interpret Per One.
- Quantity, coordinate or nonzero-start meaning needs teaching: use Test and Explain Proportional Relationships. Its unchanged first lesson and teacher guide are included in this ZIP. Its original later checks remain in their own collection.
- Those prerequisites are secure: begin the new Starting Task, then teach Rate from Changes, Build a Rule and Graph, and Compare Rate and Output.
This connected mathematical-relationships route uses selected Grades 5–6 foundations, Grade 6 ratio/per-one work, selected Grade 7 reasoning and the new selected Grade 8 supplement. Choose by the learner’s actual response and added prerequisites. It is not a complete course or coverage of every topic across those grades.
Teach rate and initial value from observations
A larger output jump may simply span more input units. The lessons model change in output divided by change in input, using unequal intervals and two nonzero observations. Learners recover the initial value by subtracting the signed changing part, verify both points, and connect a rule to a labeled table and graph.
Worked examples and learner practice include positive, negative and zero rates; negative Celsius reference values and a zero water start; and continuous time versus complete-panel counts. A value at zero is a contextual initial value only when zero belongs to the stated model. Two recorded points do not establish an unrestricted physical process.
Choose the response teaching from the explanation
- Raw jumps or output divided by one input are used as the rate: teach Match the Input Changes.
- An observed total is called the start, or the initial value is omitted: teach Recover the Starting Value.
- Greater rate or greater starting amount is treated as greater output throughout: teach Compare at the Same Input.
- Rate and initial value are sound but representation is incomplete: return to the relevant labeled table, graph or point-description practice.
Each response file supplies an actual model and different learner practice. The teacher guide gives task-specific answers, exact equivalents, defensible alternatives and neutral questions. A correct number alone may not show the requested reasoning.
Teacher preparation and complete answers
- Linear Relationships Start Here: Printable PDF · Editable Word · HTML text
- Linear Relationships Local Teaching Record: Printable PDF · Editable Word · HTML text
- Linear Relationships Teacher Guide and Keys: Printable PDF · Editable Word · HTML text
Student files to select
- Linear Relationships Starting Task: Printable PDF · Editable Word · HTML text
- Find Rate from Changes: Printable PDF · Editable Word · HTML text
- Build a Rule and Graph: Printable PDF · Editable Word · HTML text
- Compare Rate and Output: Printable PDF · Editable Word · HTML text
- Match the Input Changes: Printable PDF · Editable Word · HTML text
- Recover the Starting Value: Printable PDF · Editable Word · HTML text
- Compare at the Same Input: Printable PDF · Editable Word · HTML text
- Linear Relationships Independent Check: Printable PDF · Editable Word · HTML text
- Linear Relationships Follow-up Check: Printable PDF · Editable Word · HTML text
- Linear Relationships Later Transfer: Printable PDF · Editable Word · HTML text
Use fresh checks and changed-setting transfer
Use Starting Task before discussing its answers. After teaching, give Independent Check separately. Respond to the explanation, allow another learning opportunity, then use unused Follow-up Check. Save Later Transfer for a later occasion: it changes to panel lengths, Celsius temperature, a constant model and a zero input outside the domain.
The follow-up adds decreasing models and a negative reference value; the forms are not calibrated to equal difficulty. Record help, calculator use, prior answer exposure and response mode on the supplied local record. A shown or coached task becomes practice. Compare the actual criteria and support, not just counts of correct answers.
Complete classroom download
ZIP files · teacher preparation only
This archive may combine teaching, later tasks and answers. Choose the individual resource and its stage-specific pages before making student handouts.
Download the complete classroom collection: thirteen document sets in PDF, editable Word and HTML, two labeled graph images and the unchanged earlier proportional relationship lesson and teacher guide. Thirty-four print pages cover the new teaching. Browse individual files. Keep teacher answers and unused later tasks with the teacher; share only the selected student pages.
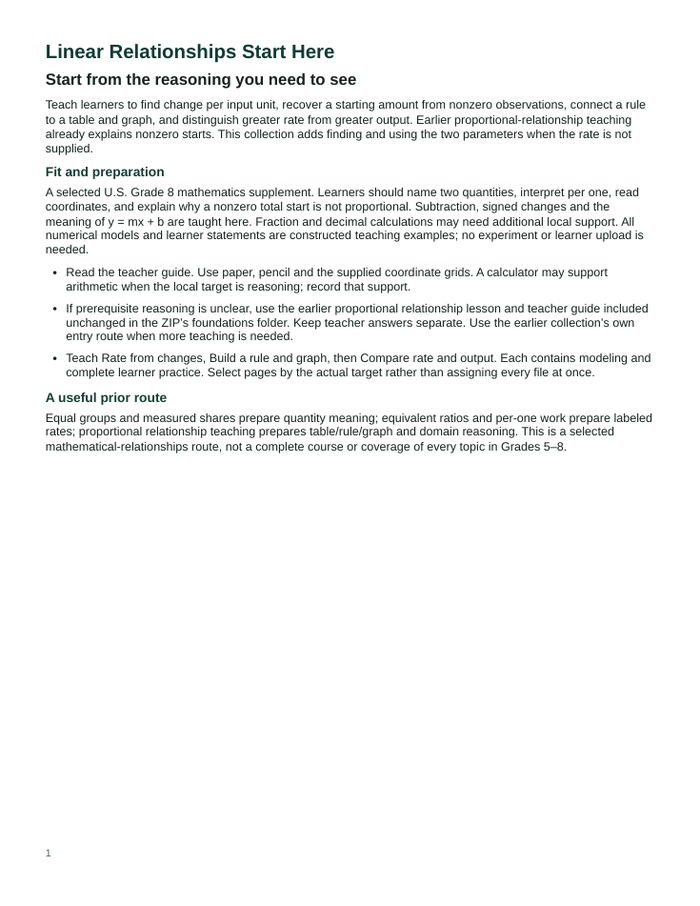
Preparation and classroom use
Read Start Here and the teacher guide; select student pages and use paper, pencils and the supplied grids. Read-aloud, enlarged text, extra time, calculators for arithmetic or agreed oral/table/point-description responses may preserve the reasoning target. Record the support and any changed target. Supplying the differences, rule or equality reasoning changes independence. Graphs have quantity and point descriptions.
This is a selected U.S. Grade 8 mathematics supplement after labeled rates, proportional relationships and coordinates. It explicitly teaches signed changes and parameter recovery; fraction/decimal arithmetic may need local support. It references selected modeling and comparison in CCSS 8.F.B.4 and 8.F.A.2. It is not full-standard, grade or course coverage.
All models, data, graphs and learner statements are constructed teaching examples. Classroom effectiveness has not been established. No account, payment or student upload is needed. Print and adapt under the Terms of Use, keep attribution, identify changes and check Word print preview after editing. Report a resource issue.
Share this resource
Report a resource issue · Open an issue email
Do not include student names or identifiable work in an issue report. Page revision: 23 October 2026; classroom files retain their own editions.