
Middle-school physical science · Grade 6
Read Temperature Data Before Explaining It
Read temperature records, distinguish values from changes and observations from explanations.
Is this the right resource?
- Audience / fit
- Intended Grade 6 science; selected Grades 6–8 standards ideas
- Teaching or planning target
- Read temperature records, distinguish values from changes and observations from explanations.
- Essential prerequisites
- Read a small table, subtract whole numbers and recognize °C. The included prerequisite check supplies support.
- Preparation
- Read the quick start and choose the student pages; preparation time depends on the selected route.
- Use time
- Allow about 35–45 minutes for the full lesson, 10–15 for a reteach, 5–8 for a later check. Planning estimate; adjust for your class.
- Materials
- Paper and pencil; optional calculator, number line, projection, pointing or oral response. Equipment-free; no practical experiment.
- What to print
- Use the stage-specific student choices below and the matching teacher guide. Give independent, new-evidence and later-assessment pages only at their intended stage.
Start teaching
Print the bridge, model and guided practice first, then give the separate independent check. Quick Check in the original files repeats that independent task; it is not fresh evidence. Choose a reteach page from the teacher guide and retain the later assessment until its intended use. Use only the selected stage, not the complete student packet.
Thermal Energy Evidence Kits foundation collection · All free resources
- Learning target
- Read temperature records, distinguish values from changes and observations from explanations.
- Prerequisites
- Read a small table, subtract whole numbers and recognize °C. The included prerequisite check supplies support.
- Materials
- Paper and pencil; optional calculator, number line, projection, pointing or oral response. Equipment-free; no practical experiment.
- Audience
- For Grade 6. Relevant NGSS expectations span Grades 6–8; check local placement. This addresses selected components, not complete standards coverage.
- Time
- Allow about 35–45 minutes for the full lesson, 10–15 for a reteach, 5–8 for a later check.
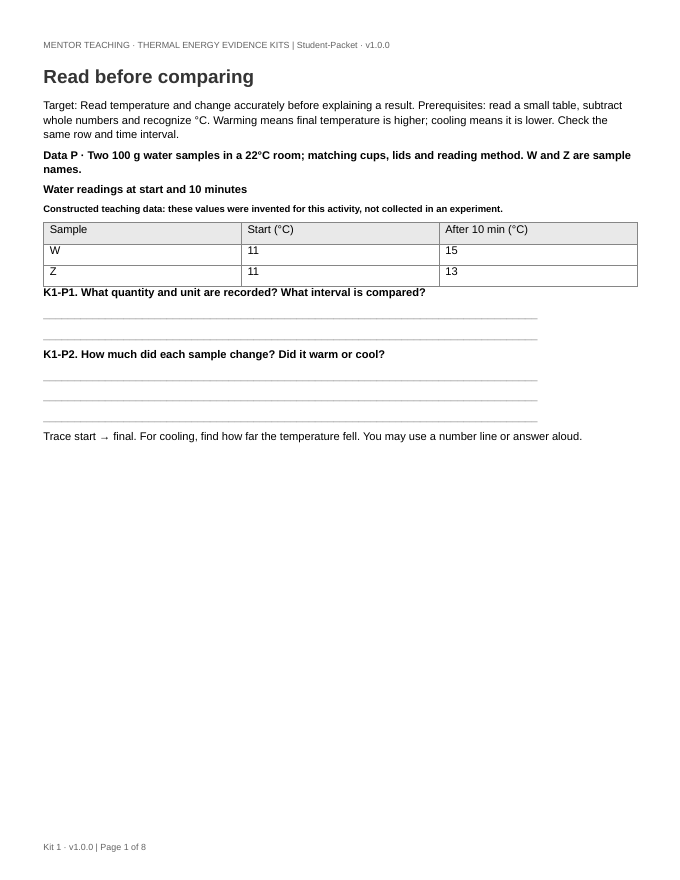
Constructed teaching data: these values were invented for this activity, not collected in an experiment. No actual sleeve or product performance is established.
Choose what to print
Additional files · teacher preparation
Use the separate stage choices above for student handouts. Complete selections may include later tasks or answers.
Teach the LessonAdditional files · teacher preparation
Use the separate stage choices above for student handouts. Complete selections may include later tasks or answers.
Use a Quick CheckAdditional files · teacher preparation
Use the separate stage choices above for student handouts. Complete selections may include later tasks or answers.
Reteach Compare the MeasurementsAdditional files · teacher preparation
Use the separate stage choices above for student handouts. Complete selections may include later tasks or answers.
Reteach Value or ChangeAdditional files · teacher preparation
Use the separate stage choices above for student handouts. Complete selections may include later tasks or answers.
Use a Later Check
Each selection includes its own setup and data. Quick Check repeats the lesson’s independent task; save Later Check for a new response after teaching. Match task headings with the teacher answer key.
Student first page
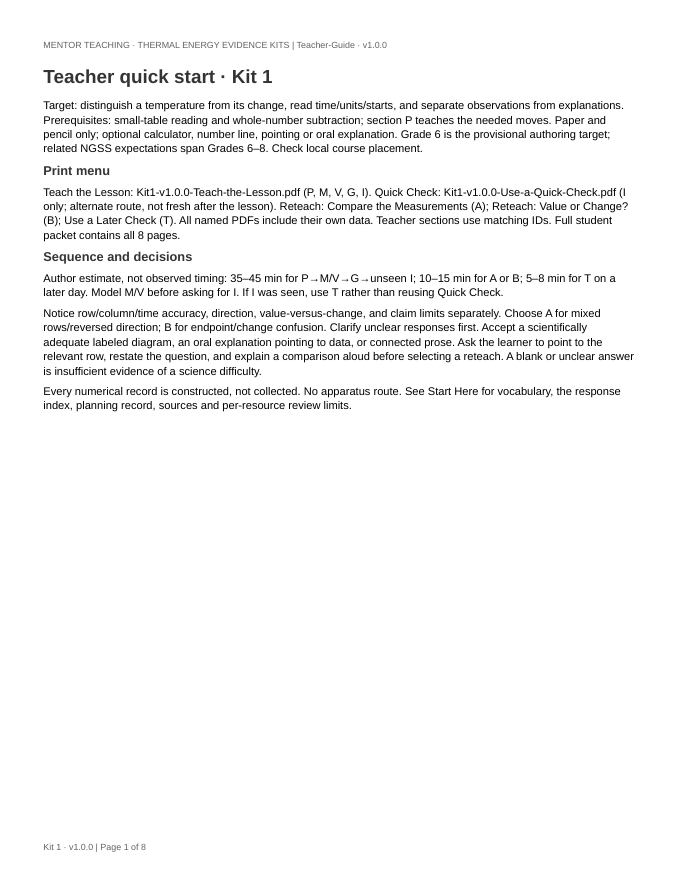
Teacher first page
Student files
Additional files · teacher preparation
Use the separate stage choices above for student handouts. Complete selections may include later tasks or answers.
Student printable PDFAdditional files · teacher preparation
Use the separate stage choices above for student handouts. Complete selections may include later tasks or answers.
Student editable Word fileAdditional files · teacher preparation
Use the separate stage choices above for student handouts. Complete selections may include later tasks or answers.
Read the student file as HTML
Choose a stage and format
Give only the stage being used. Keep later tasks and all teacher keys with the teacher until needed.
- Prerequisite bridge, model and guided practice · PDF (4 pages) · Prerequisite bridge, model and guided practice · editable Word · Prerequisite bridge, model and guided practice · browser copy
- Independent check · PDF (1 page) · Independent check · editable Word · Independent check · browser copy
- Keep readings in one row · PDF (1 page) · Keep readings in one row · editable Word · Keep readings in one row · browser copy
- A value is not a change · PDF (1 page) · A value is not a change · editable Word · A value is not a change · browser copy
- Later assessment · PDF (1 page) · Later assessment · editable Word · Later assessment · browser copy
Formats and all files
Complete reference files may include teaching, independent tasks, later evidence or teacher answers. Keep them with the teacher; use the separate stage selections above for handouts.
Teacher files
About the materials
The teacher guide includes complete keys, explanations, alternatives and guidance for choosing a next task.
Accept labeled diagrams, oral explanations pointing to data or connected prose. Clarify unclear responses before assigning a reteach. Do not require a fixed paragraph form.
Complete package
Additional files · teacher preparation
Use the separate stage choices above for student handouts. Complete selections may include later tasks or answers.
Download this resource’s classroom ZIP. Download the complete foundation collection ZIP.
Start Here supplies vocabulary, a response-to-next-task index, sources and a planning record. Use under our Terms of Use. Report a resource issue.
Apply temperature reading to thermal evidence
Compare thermal data and limit a claim supplies a complete paper lesson, separate checks, focused response teaching and teacher keys. It extends table and graph reading into a bounded design comparison using clearly labeled constructed data.
Share this resource
Report a resource issue · Open an issue email
Do not include student names or identifiable work in an issue report. Page revision: 15 October 2026; classroom files retain their own editions.