Thermal Energy
Read Temperature Data Before Explaining It student packet
Return to Read Temperature Data Before Explaining It
Read before comparing
Target: Read temperature and change accurately before explaining a result. Prerequisites: read a small table, subtract whole numbers and recognize °C. Warming means final temperature is higher; cooling means it is lower. Check the same row and time interval.
Two 100 g water samples in a 22°C room; matching cups, lids and reading method. W and Z are sample names.
Constructed teaching data: these values were invented for this activity, not collected in an experiment.
| Sample | Start (°C) | After 10 min (°C) |
|---|---|---|
| W | 11 | 15 |
| Z | 11 | 13 |
1.What quantity and unit are recorded? What interval is compared?
2.How much did each sample change? Did it warm or cool?
Trace start → final. For cooling, find how far the temperature fell. You may use a number line or answer aloud.
Read the whole record
Question: Which sample warmed less during these 15 minutes? Read one complete column before comparing samples.
X and Y each contain 100 g water starting at 10°C in a 22°C room. Cups, lids, measurement method and exposure match. This is one illustrative trial of two complete setups.
Constructed teaching data: these values were invented for this activity, not collected in an experiment.
| Time (min) | Sample X (°C) | Sample Y (°C) |
|---|---|---|
| 0 | 10 | 10 |
| 5 | 13 | 11 |
| 10 | 15 | 12 |
| 15 | 17 | 13 |
1.Name the measured quantity and units. Give two observations without a cause.
2.Calculate each 0-to-15-minute change. Which sample warmed less?
3.Is “Y became cooler” accurate? What can this record tell us, and what cannot it explain?
A final value is a reading. A change compares the start and finish for that sample. The next page shows the same record as a graph.
The same record as a graph
Data M again · Same 100 g samples, 10°C start, 22°C room, matching cups/lids, method and 15-minute exposure. This graph repeats the model record; it is not a second trial.
Constructed teaching data: these values were invented for this activity, not collected in an experiment.
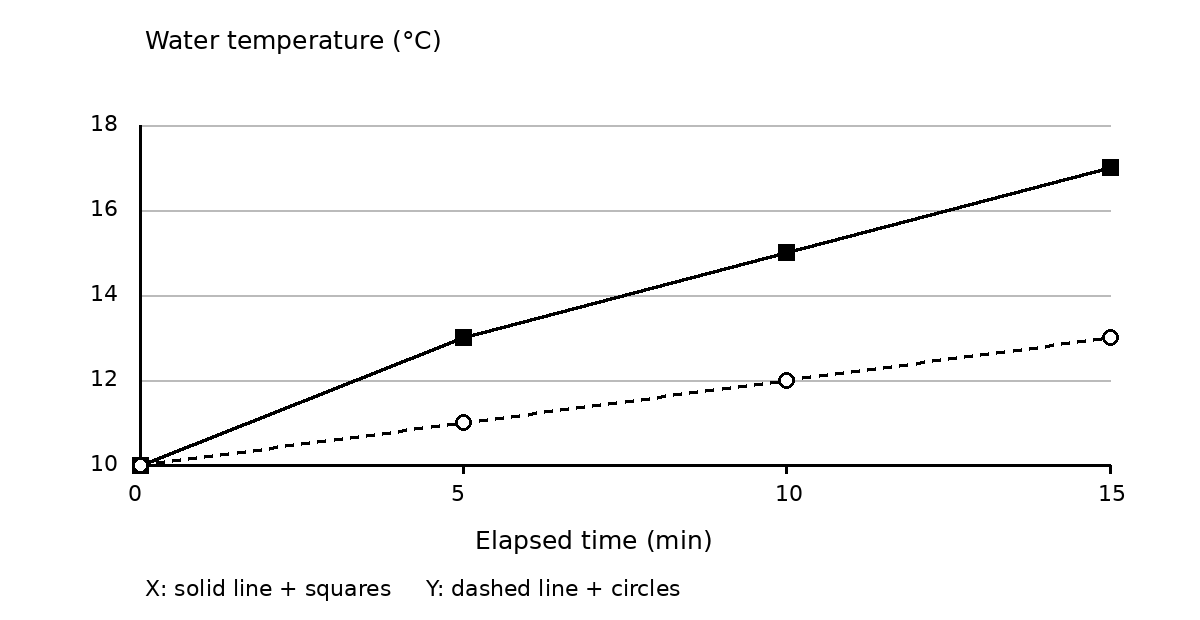
1.Read X at 10 minutes and Y at 15 minutes. Identify each axis and its unit.
2.Does the graph provide new measurements? Explain how its time spacing matches the table.
You may use the model table instead of the graph. Drawing a graph is not required to show the science.
Guided practice · Cooling
K and L each contain 100 g water starting at 32°C in a 22°C room. Cups, lids, 15-minute exposure and reading method match; two complete setups, one trial. This is a paper task.
Constructed teaching data: these values were invented for this activity, not collected in an experiment.
| Time (min) | Sample K (°C) | Sample L (°C) |
|---|---|---|
| 0 | 32 | 32 |
| 5 | 29 | 30 |
| 10 | 27 | 29 |
| 15 | 25 | 28 |
1.Compare start and finish for K and L. State direction and size of each change.
2.Which setup shows less cooling? Why would choosing the lowest final value miss this goal?
3.Which statement is an observation: “K is 25°C at 15 minutes” or “K loses energy only by conduction”? Explain.
Independent task · New readings
Use the table without repeating the model answer. You may explain aloud, use a labeled diagram or write.
All samples have 100 g water in a 25°C room, matching cups/lids and measurement method. Each is read after 20 minutes. S has a different starting temperature. This is one trial.
Constructed teaching data: these values were invented for this activity, not collected in an experiment.
| Sample | Start (°C) | After 20 min (°C) |
|---|---|---|
| Q | 14 | 18 |
| R | 14 | 21 |
| S | 20 | 22 |
1.Name quantity, units and interval. Find each change and say whether it warmed or cooled.
2.Which is cooler at the end, Q or S? Which changed less? Explain why these are different questions.
3.What comparison of Q and R is supported? Can the lower change of S identify a better thermal protector? Give a limit.
Keep readings in one row
Equal 100 g water samples in a 24°C room; matching cups, lids and method. Same 10-minute interval.
Constructed teaching data: these values were invented for this activity, not collected in an experiment.
| Sample | Start (°C) | After 10 min (°C) |
|---|---|---|
| E | 12 | 16 |
| F | 12 | 19 |
1.Trace E from start to finish, then F. Calculate each increase. Check a fictional answer: “E changed by 7°C because 19 − 12 = 7.”
Fresh check
Fresh equal 100 g samples in a 22°C room; matching cups, lids, method and 10-minute interval. Paper cooling task.
Constructed teaching data: these values were invented for this activity, not collected in an experiment.
| Sample | Start (°C) | After 10 min (°C) |
|---|---|---|
| J | 28 | 25 |
| K | 28 | 26 |
2.Find both changes, name the direction and explain which row you used.
A value is not a change
Two 100 g samples in a 24°C room, matching cups/lids, method and 15-minute exposure. Their starts differ.
Constructed teaching data: these values were invented for this activity, not collected in an experiment.
| Sample | Start (°C) | After 15 min (°C) |
|---|---|---|
| U | 14 | 19 |
| V | 18 | 21 |
1.Which has the warmer final value? Which warmed more? Explain why the larger final value need not mean a larger increase.
2.Does this comparison isolate a protector effect? Explain using the starting conditions.
Fresh check
Fresh equal 100 g samples starting together in a 22°C room; cups, lids, method and 15-minute interval match. Paper task.
Constructed teaching data: these values were invented for this activity, not collected in an experiment.
| Sample | Start (°C) | After 15 min (°C) |
|---|---|---|
| C | 32 | 29 |
| D | 32 | 27 |
3.Find each fall. Which better limits cooling in this record? Use change as well as the endpoint.
Later check · A changed direction
Fresh equal 100 g samples in a 22°C room; matching cups/lids, method and 15-minute exposure. This is one paper cooling comparison.
Constructed teaching data: these values were invented for this activity, not collected in an experiment.
| Sample | Start (°C) | After 15 min (°C) |
|---|---|---|
| M | 32 | 28 |
| N | 32 | 30 |
1.Read the labels and calculate both changes with direction.
2.Which setup better limits cooling here? Give a matched comparison and one limit.
3.A fictional response says, “A sample at 20°C has twice the total energy of one at 10°C.” Does a Celsius reading support this? Explain.