Thermal Energy
Explain Why the Temperature Changed student packet
Return to Explain Why the Temperature Changed
Observation, evidence, explanation
Target: Explain a temperature pattern using observations and a scientific idea. Prerequisites: read headings/°C/time, subtract and identify warming/cooling. Follow one sample from its start to finish. An observation describes a supplied reading. Evidence is a relevant observation selected for a question. An explanation connects evidence to a scientific idea.
H is 100 g of water in a covered cup. All surroundings stay at 23°C. Covered liquid water; no active heating/cooling, ice, phase change, direct sunlight or meaningful evaporative cooling. Room, cup, lid and supporting surfaces are at the stated surrounding temperature; it stays constant. Readings represent the sample temperature with a consistent procedure. This is a paper scenario, not apparatus instructions.
Constructed teaching data: these values were invented for this activity, not collected in an experiment.
| Sample | Start (°C) | After 10 min (°C) |
|---|---|---|
| H | 13 | 17 |
1.Identify the sample and surroundings, their starting temperatures, the interval and the sample’s change.
2.Classify these fictional statements: (a) H reads 17°C at 10 min; (b) I use 13→17°C to show warming; (c) energy transfers from warmer surroundings toward cooler water. Which adds a scientific explanation?
Vocabulary: sample = the matter being studied; surroundings = parts outside that sample; net = overall transfer after transfers in opposite directions are considered. You may point, speak or draw.
Explain this record
Question: Why did the water’s temperature change during these 15 minutes? We are explaining one pattern, not choosing a winning sleeve.
One 100 g covered liquid-water sample begins at 12°C. Surroundings stay at 24°C. Covered liquid water; no active heating/cooling, ice, phase change, direct sunlight or meaningful evaporative cooling. Room, cup, lid and supporting surfaces are at the stated surrounding temperature; it stays constant. Readings represent the sample temperature with a consistent procedure. This is a paper scenario, not apparatus instructions.
Constructed teaching data: these values were invented for this activity, not collected in an experiment.
| Elapsed time (min) | Water (°C) |
|---|---|
| 0 | 12 |
| 5 | 14 |
| 10 | 16 |
| 15 | 17 |
Fictional incomplete response: “It was 12°C at the start and 17°C at 15 minutes. It went up 5°C.”
1.Which part of this response describes the record? What explanatory connection is still missing?
2.Use the warmer/cooler parts and net energy transfer to extend the answer. Include a limit.
Model representation · Sample and surroundings
repeated:100 g water,12°C start→17°C at 15 min; all surroundings 24°C. This representation explains the record. Its arrow is a scientific model, not a thermometer observation.
Constructed teaching data: these values were invented for this activity, not collected in an experiment.
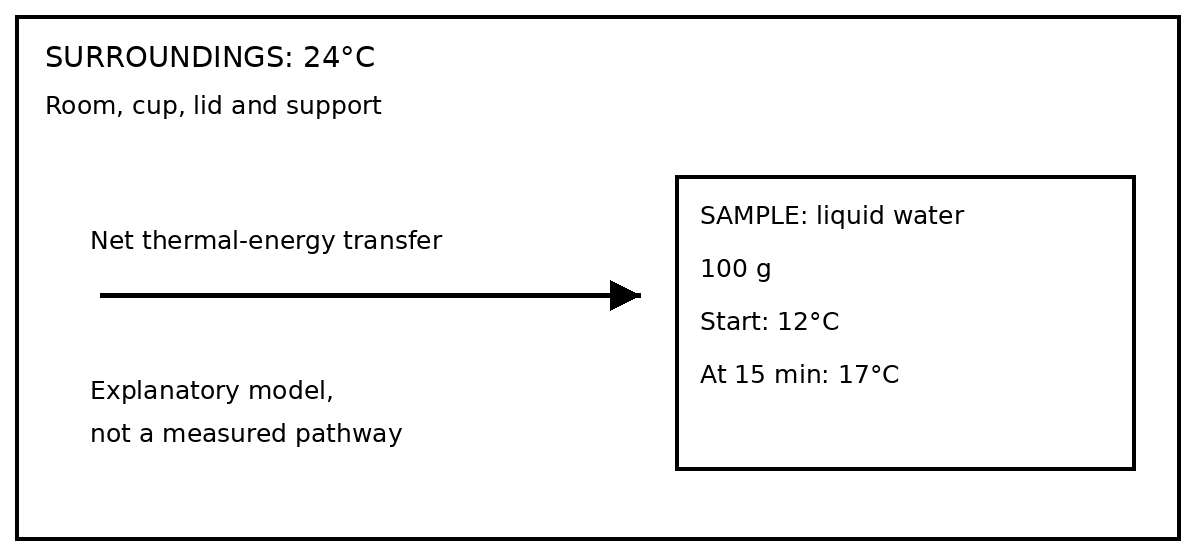
1.What is observed in the table? What does the representation add? Does it prove that only conduction occurred?
The accompanying text describes every label and arrow. A diagram can show reasoning without a fixed paragraph format.
Guided practice · Explain a different record
One 100 g water sample begins at 37°C. Covered cup and other surroundings stay at 21°C. Covered liquid water; no active heating/cooling, ice, phase change, direct sunlight or meaningful evaporative cooling. Room, cup, lid and supporting surfaces are at the stated surrounding temperature; it stays constant. Readings represent the sample temperature with a consistent procedure. This is a paper scenario, not apparatus instructions.
Constructed teaching data: these values were invented for this activity, not collected in an experiment.
| Elapsed time (min) | Water (°C) |
|---|---|
| 0 | 37 |
| 5 | 34 |
| 10 | 32 |
| 15 | 30 |
1.Select two relevant readings and describe the size and direction of change.
2.Name sample/surroundings and the direction of net thermal-energy transfer. Explain how that connects to the readings.
3.Evaluate the fictional statement “The lower reading means a better sleeve.” What question are we answering, and what cannot this table establish?
Independent task · Explain the record
Use relevant measurements, a scientific connection and a limit. You may write, speak while pointing to data, or draw a labeled representation. This is also the Use a Quick Check task; it is reused, not fresh, after this page has been attempted.
Three independent trials each use fresh 80 g liquid-water samples in the same covered-cup design. All surroundings stay at 20°C. The 12-minute interval and reading procedure match within/across trials. Covered liquid water; no active heating/cooling, ice, phase change, direct sunlight or meaningful evaporative cooling. Room, cup, lid and supporting surfaces are at the stated surrounding temperature; it stays constant. Readings represent the sample temperature with a consistent procedure. This is a paper scenario, not apparatus instructions.
Constructed teaching data: these values were invented for this activity, not collected in an experiment.
| Trial ID | Start (°C) | After 12 min (°C) |
|---|---|---|
| I-1 | 31 | 27 |
| I-2 | 31 | 26 |
| I-3 | 31 | 27 |
1.Use at least two trials to describe the temperature pattern and changes.
2.Explain the pattern. Identify the sample, surroundings, warmer/cooler parts and direction of net thermal-energy transfer.
3.State one meaningful limit and information or a comparison that would address it. What was observed, and what is part of your explanatory model?
Connect evidence to the explanation
100 g liquid water in a covered cup;26°C surroundings remain constant. Covered liquid water; no active heating/cooling, ice, phase change, direct sunlight or meaningful evaporative cooling. Room, cup, lid and supporting surfaces are at the stated surrounding temperature; it stays constant. Readings represent the sample temperature with a consistent procedure. This is a paper scenario, not apparatus instructions.
Constructed teaching data: these values were invented for this activity, not collected in an experiment.
| Elapsed time (min) | Water (°C) |
|---|---|
| 0 | 15 |
| 5 | 18 |
| 10 | 20 |
Fictional response 1: “It reads 15,18 and 20°C, so it changed.” Fictional response 2: “Energy goes from warmer to cooler, so something changed.”
1.What does each fictional response supply, and what connection is missing? Point to the evidence you would use.
2.Connect specific readings to the warmer/cooler parts and net energy transfer. Include what the table does not directly measure.
Optional prompts: What changed? Which part was warmer? In which direction is the net transfer? How is that consistent with the sample’s change?
Fresh recheck · Connect a new record
Fresh 90 g covered liquid-water sample; all surroundings stay at 23°C. Covered liquid water; no active heating/cooling, ice, phase change, direct sunlight or meaningful evaporative cooling. Room, cup, lid and supporting surfaces are at the stated surrounding temperature; it stays constant. Readings represent the sample temperature with a consistent procedure. This is a paper scenario, not apparatus instructions.
Constructed teaching data: these values were invented for this activity, not collected in an experiment.
| Sample | Start (°C) | After 8 min (°C) |
|---|---|---|
| R | 35 | 31 |
1.Explain the change using the sample’s readings, the surrounding temperature and net transfer direction. Add a limit.
This record was not used in the intervention. If it was shown earlier, record that exposure; it is then not a fresh check.
Trace energy transfer
Matched 100 g samples begin at 10°C in 22°C surroundings. Cups/lids,15 min, exposure and procedure match; sleeves are complete designs. Covered liquid water; no active heating/cooling, ice, phase change, direct sunlight or meaningful evaporative cooling. Room, cup, lid and supporting surfaces are at the stated surrounding temperature; it stays constant. Readings represent the sample temperature with a consistent procedure. This is a paper scenario, not apparatus instructions.
Constructed teaching data: these values were invented for this activity, not collected in an experiment.
| Setup | Start (°C) | After 15 min (°C) |
|---|---|---|
| No sleeve | 10 | 18 |
| Sleeve V | 10 | 14 |
Fictional response 1: “Cold entered through the cup.” Fictional response 2: “Sleeve V made cold.” Fictional response 3: “V stopped all energy transfer.”
1.For each statement, ask what the speaker means. Which readings and scientific idea would help check it?
2.Explain V’s change. Draw or describe the net-transfer arrow and revise the stopped-transfer claim. Explain how limiting warming differs from cooling.
Words alone may be imprecise. Show the parts and direction before deciding whether the idea is misunderstood.
Fresh recheck · Trace a new case
Fresh 100 g covered sample with a sleeve in 21°C surroundings. Covered liquid water; no active heating/cooling, ice, phase change, direct sunlight or meaningful evaporative cooling. Room, cup, lid and supporting surfaces are at the stated surrounding temperature; it stays constant. Readings represent the sample temperature with a consistent procedure. This is a paper scenario, not apparatus instructions.
Constructed teaching data: these values were invented for this activity, not collected in an experiment.
| Sample | Start (°C) | After 10 min (°C) |
|---|---|---|
| Sleeved W | 33 | 29 |
1.Explain this temperature change and the direction of net energy transfer. Does the sleeve generate cold or stop all transfer? Use the record and set a limit.
Later check · A changed setting
A 60 g covered liquid-water sample is placed in a chamber whose room/cup/lid/support stay at 19°C. Covered liquid water; no active heating/cooling, ice, phase change, direct sunlight or meaningful evaporative cooling. Room, cup, lid and supporting surfaces are at the stated surrounding temperature; it stays constant. Readings represent the sample temperature with a consistent procedure. This is a paper scenario, not apparatus instructions.
Constructed teaching data: these values were invented for this activity, not collected in an experiment.
| Elapsed time (min) | Liquid water (°C) |
|---|---|
| 0 | 9 |
| 6 | 12 |
| 12 | 14 |
1.Explain the pattern using readings, sample/surroundings and net-transfer direction. State what this table cannot prove.
This is a paper task. No chamber or water handling is required.
Later check · Idealized equal temperatures
Conceptual case: liquid water, cup/lid/support and room are uniformly and exactly 22°C and remain so. The water is in thermal contact with its surroundings. No active source, phase change, evaporation or other energy input/output. These idealized conditions are stipulated, not inferred from readings.
Constructed teaching data: these values were invented for this activity, not collected in an experiment.
| Idealized case | Water (°C) | All surroundings (°C) |
|---|---|---|
| Uniform temperatures throughout | 22 | 22 |
1.Under these idealized conditions, is there net thermal-energy transfer due to a temperature difference? Explain. Does your answer mean particles stop moving?
2.In another scenario, one water reading is unchanged at 22°C. Does that alone establish thermal equilibrium? Name what else you would need to know.